This process shows you how to create a Lot Map based on the Lots on a Control Line. Lot Mapping allows you to view and track all the Work Types, Work Coverage based on Lot Chainage and Lot Status in a single document.
Relevant Links :
Tutorial:
Instructions:
1. Select your project and navigate to “QA Setup” and select “Lot Mapping”.
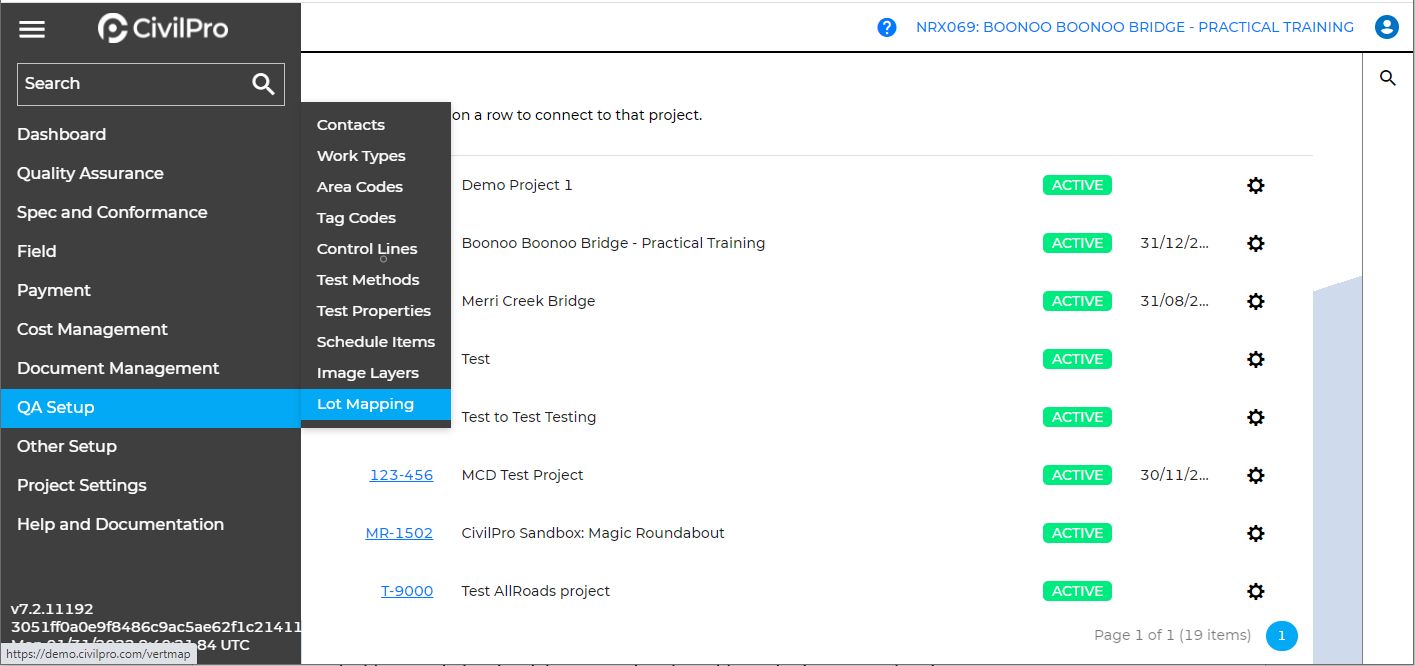
2. In the Lot Mapping register, click on the “New Lot Section Map” tab.

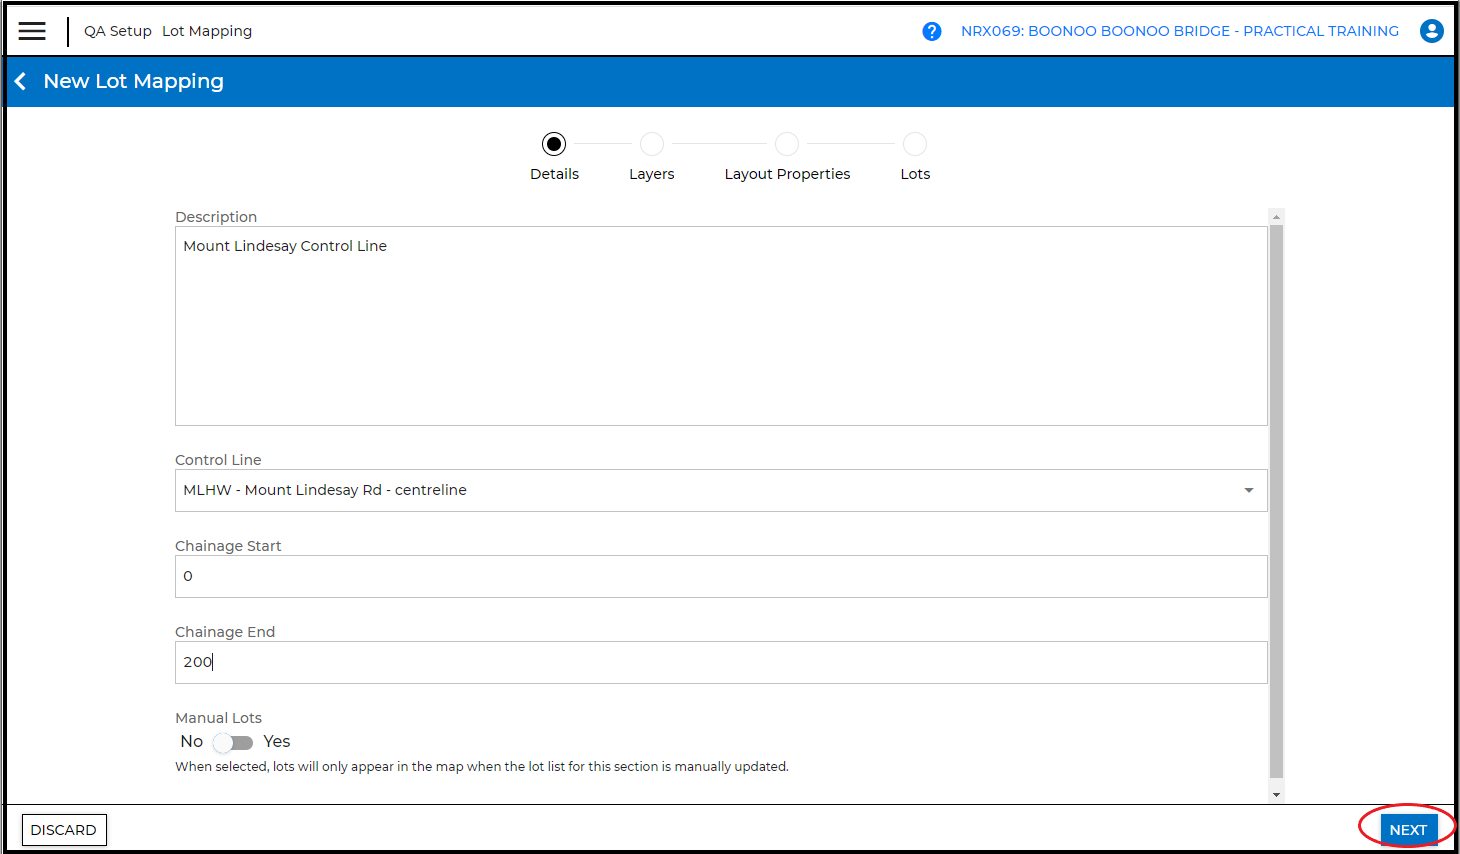
3. Complete the following fields:
- Description – Usually the description of the Control Line and the location of the chainage
- Control Line – Select the relevant “Control Line” from the dropdown list
- Chainage start – Enter the start of the chainage where the lot mapping begins
- Chainage End - Enter the end of the chainage where the lot mapping ends ( Note: The mapping can correspond to the entire or a section of the control line ).
- Manual Lots – By default, all the lots along the Control Line section will be included in the map. Selecting “Yes” for this option means that you do not wish to include every lot, and will manually select the lots to be included in the map.
Click “Next”.
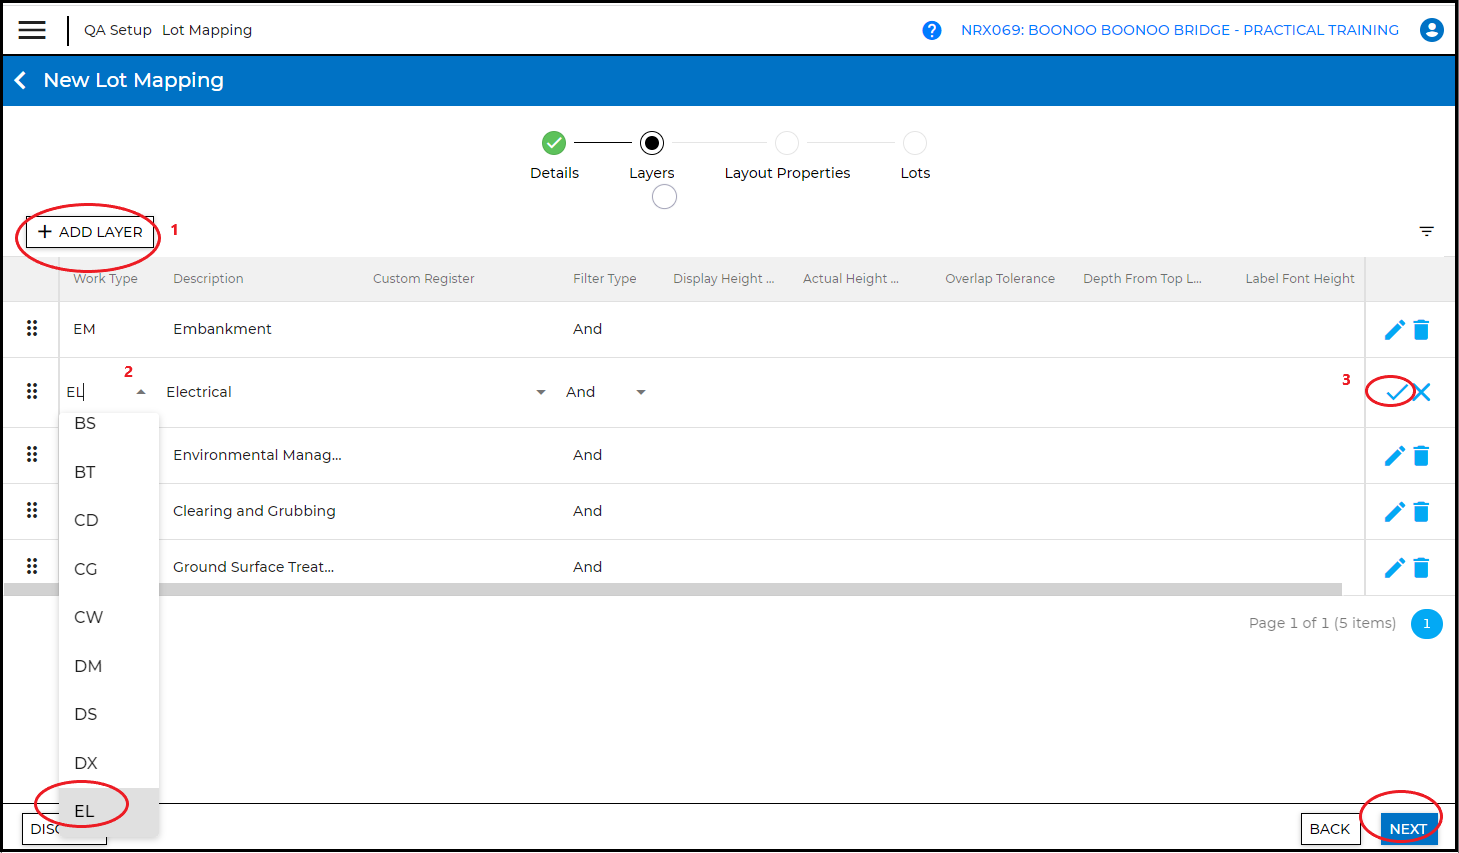
4. Click on the “Add Layer” tab.
In the “Work Type” column, select the Work Type that is relevant to the lot created along the Control Line e.g. EM for lot number EMRWS00
There are options to include Custom Register, filter and adjust the display (e.g. Display Height, Label Font Height, etc) of your Lot Map, however, these are not mandatory and will default to a standard display. You can skip these fields.
Click on the “Tick” icon to confirm selection. (To edit, click on the “Pencil” icon).
Repeat these steps to add more layers, especially if there are different work types in the map section.
Click “Next”.
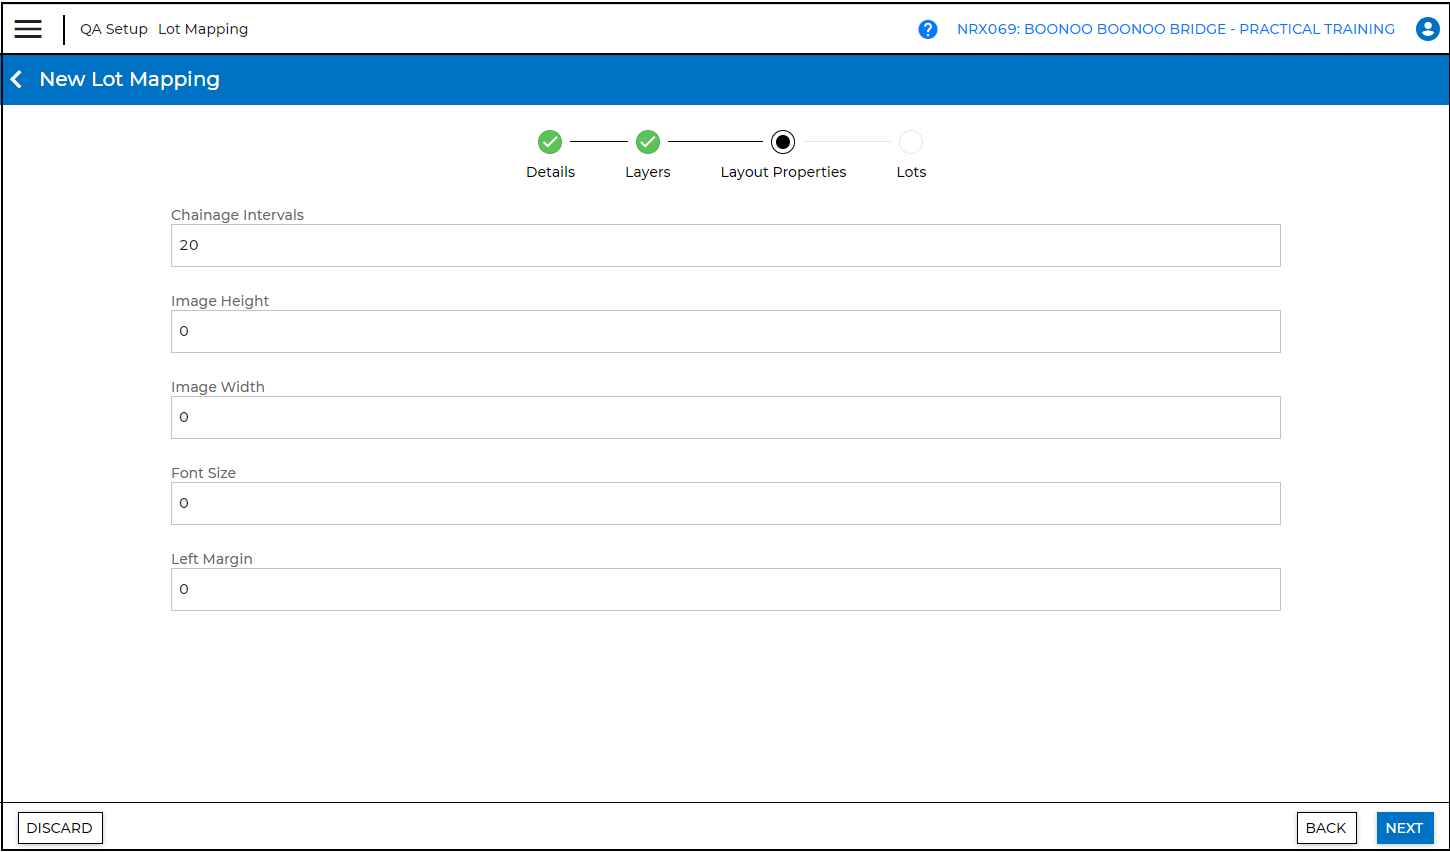
5. Complete the following fields:
- Chainage Intervals - helps to locate the lots on your Control Line in your map
- Image Height
- Image Width
- Font Size
- Left Margin
Note: These fields are not mandatory and if left blank, the map will be printed as fit-to-scale. However, adding chainage interval is strongly recommended for clarity.
Click “Next”.
6. Click on the “Update Lot List” tab to include all the lots on the Control Line section.
If you have selected “Yes” to include Lots manually on the “Details” screen, click on the “Add Lot Manually” to select specific lots.
If not all the lots on your Control section are to be included, under the “Is Excluded” column, select the Lots and click on the “Exclude Selected Lots” tab.
Click Save.

7. On the right panel, click on the “Notepad” icon.
Click “ Print Lot Map”. Here, you can also save map to Filestore.
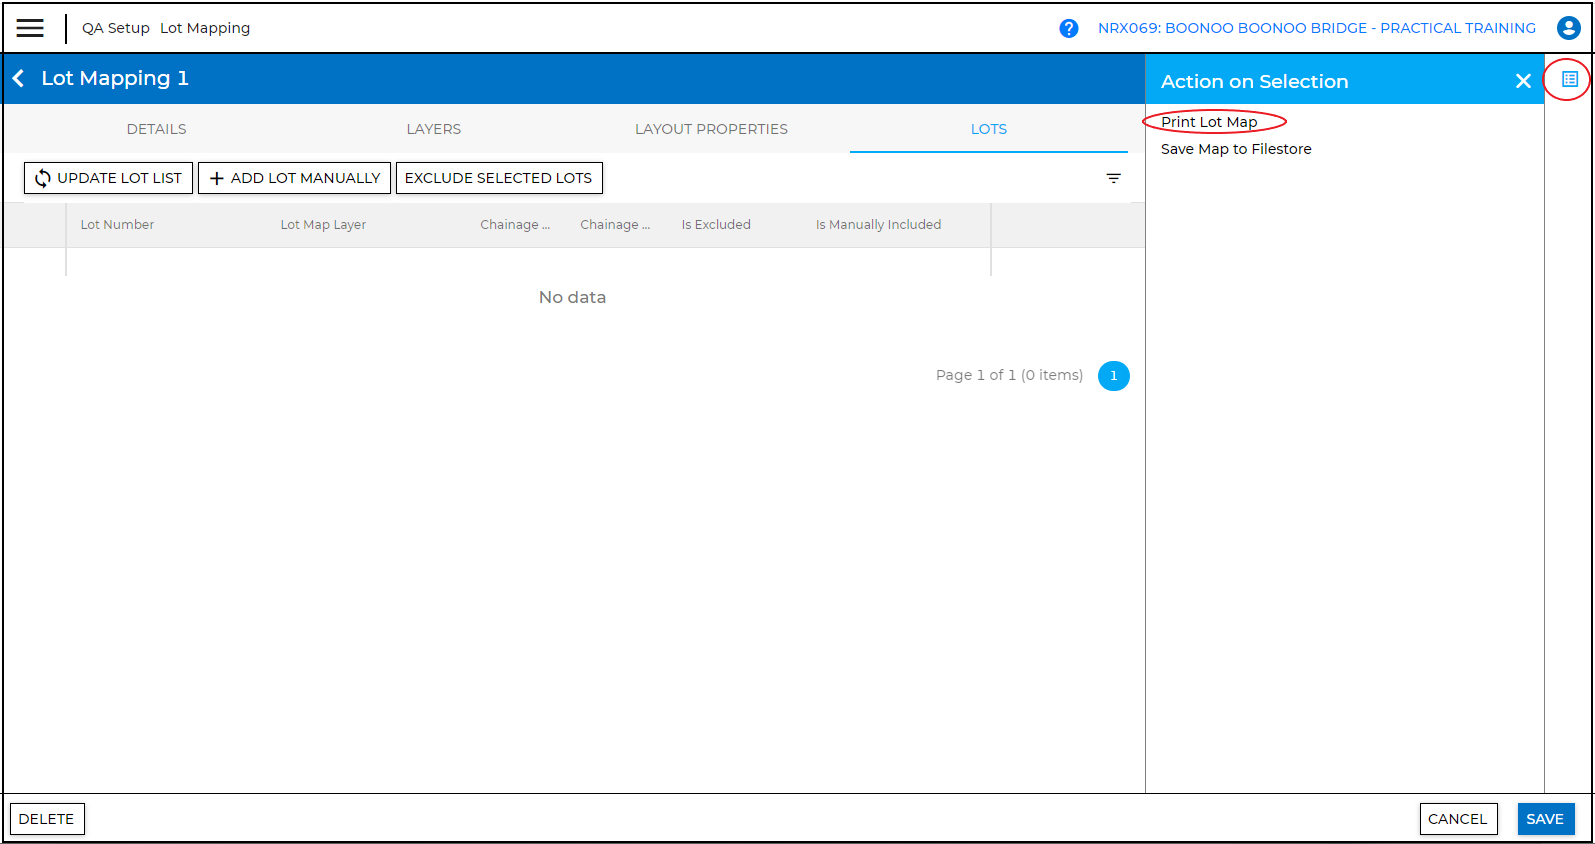
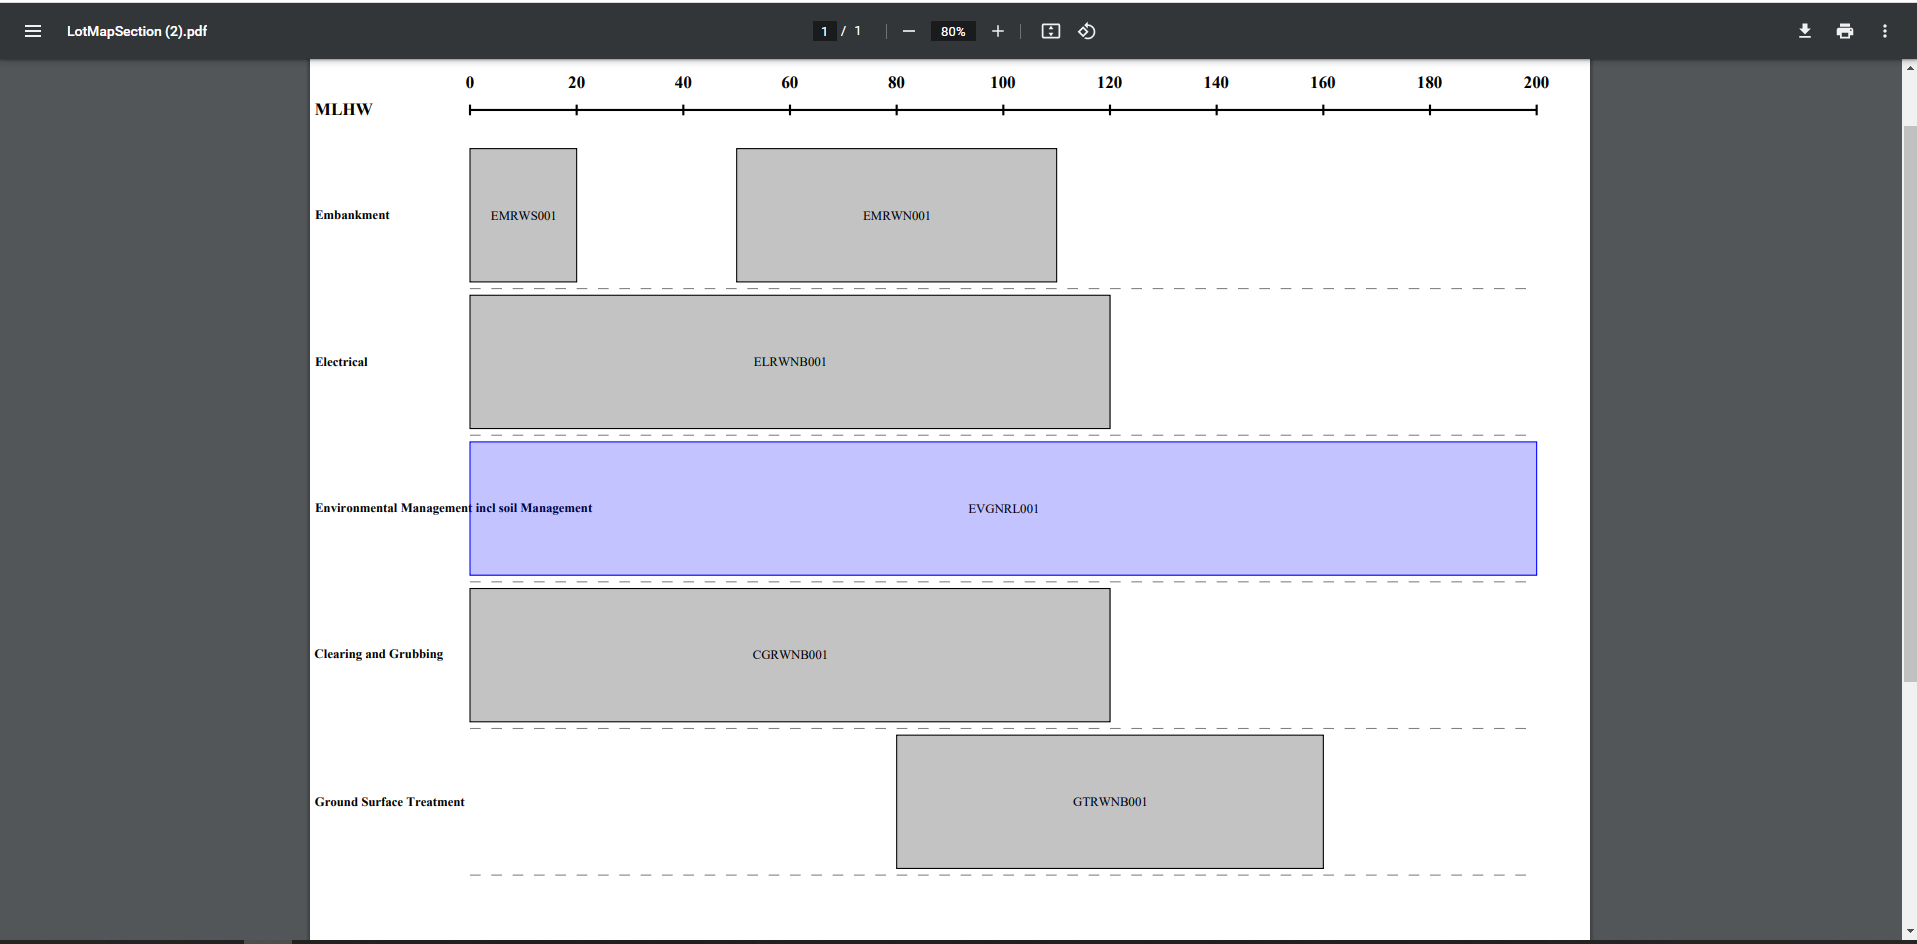
8. The Lot Map will be generated in PDF.
You can click on each Lot Number to access all the details relating to that lot.
The status of the lot is also indicated by its colour on the map e.g. Conformed Lot is purple